EcoStruxure Energy Hub

Cloud-based energy monitoring and reporting that helps organisations track performance, identify opportunities, and manage energy use across portfolios, campuses, and distributed sites.

What is Energy Hub

Energy Hub is a cloud-based energy management platform that provides multi-site visibility, analytics, reporting, and benchmarking to help organisations improve energy performance.

  • 👁️ Multi-site visibility
  • 📊 Energy reporting & analytics
  • 🌎 Sustainability reporting
  • 📈 Performance benchmarking
  • ☁️ Cloud-based access
  • ⚡ Energy performance tracking
  • 🔔 Alarming & notifications
talk to our team

Why Organisations Use PME

Blue shield outline with a lightning bolt symbol in the center representing electrical protection.

Benchmark Performance

Compare sites, identify outliers, and focus improvement efforts where they matter most.
Computer monitor displaying a bar chart and an upward trending arrow graph icon in blue outline.

Simplify Reporting

Automate energy reporting and reduce the effort required to collect and analyse data.
Blue outline of an eye with a globe grid inside as the iris.

Improve Energy Visibility

Understand how energy is being used across buildings, facilities, and portfolios.
Outlined brain with a rising bar chart and upward arrow indicating growth or improvement.

Support Sustainability

Track energy performance and support carbon reduction and decarbonisation initiatives.

Key Capabilties

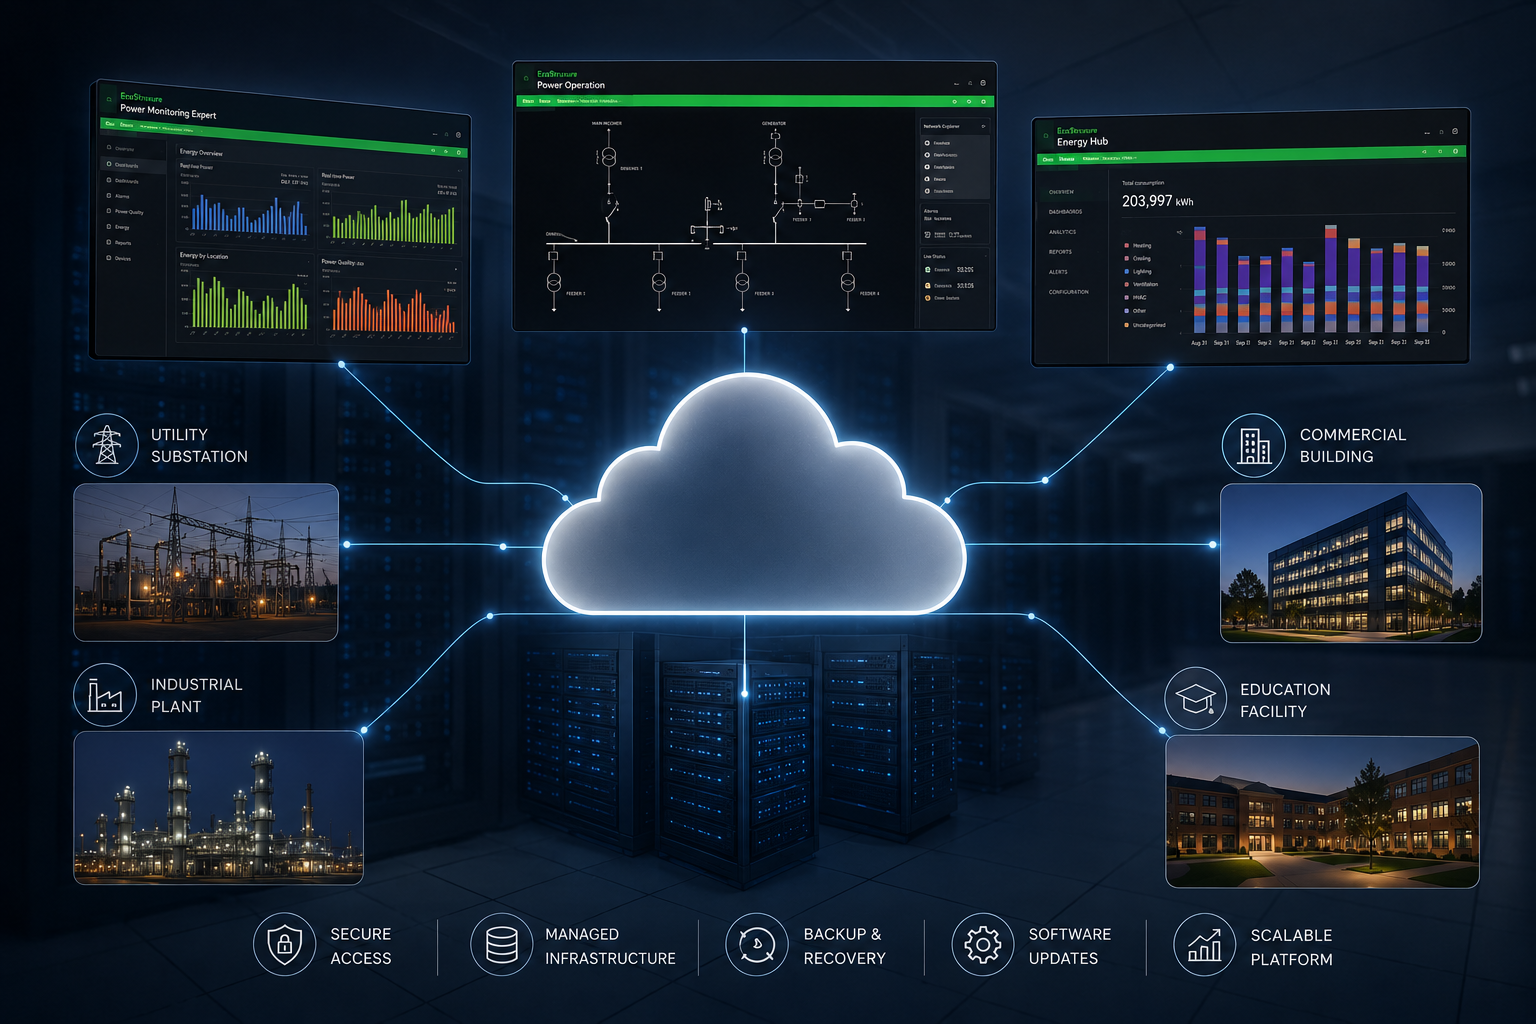
Cloud-based energy management platform linking utility, industrial, commercial, and educational facilities with secure data.
Energy Visibility & Dashboards
Visualise energy consumption across sites through intuitive dashboards and reports.
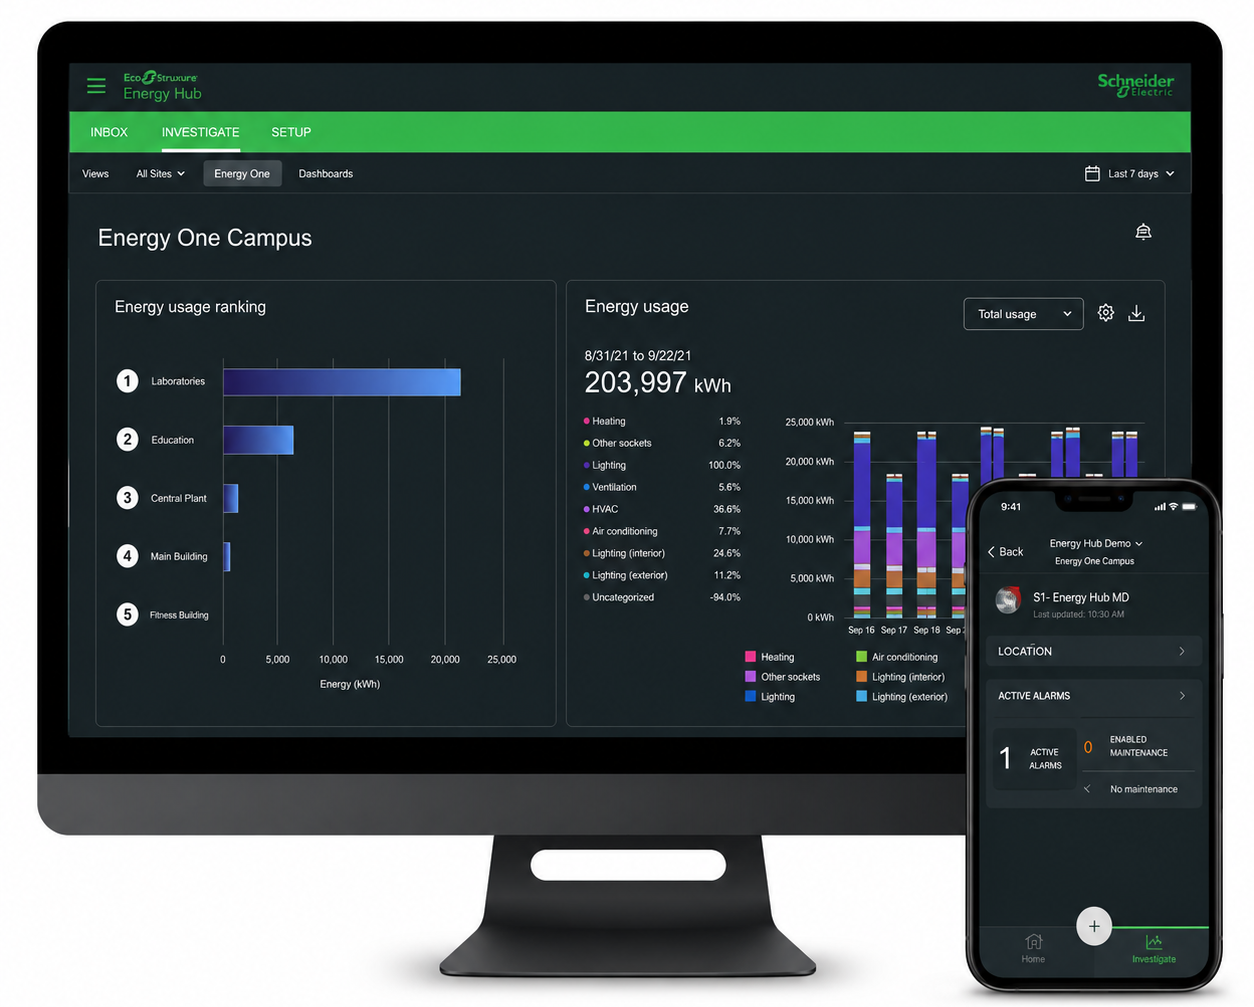
Energy Hub dashboard on monitor and phone showing Energy One Campus usage ranking and alarms.
Multi-Site Portfolio Management
Monitor performance across campuses, portfolios, and geographically distributed facilities.
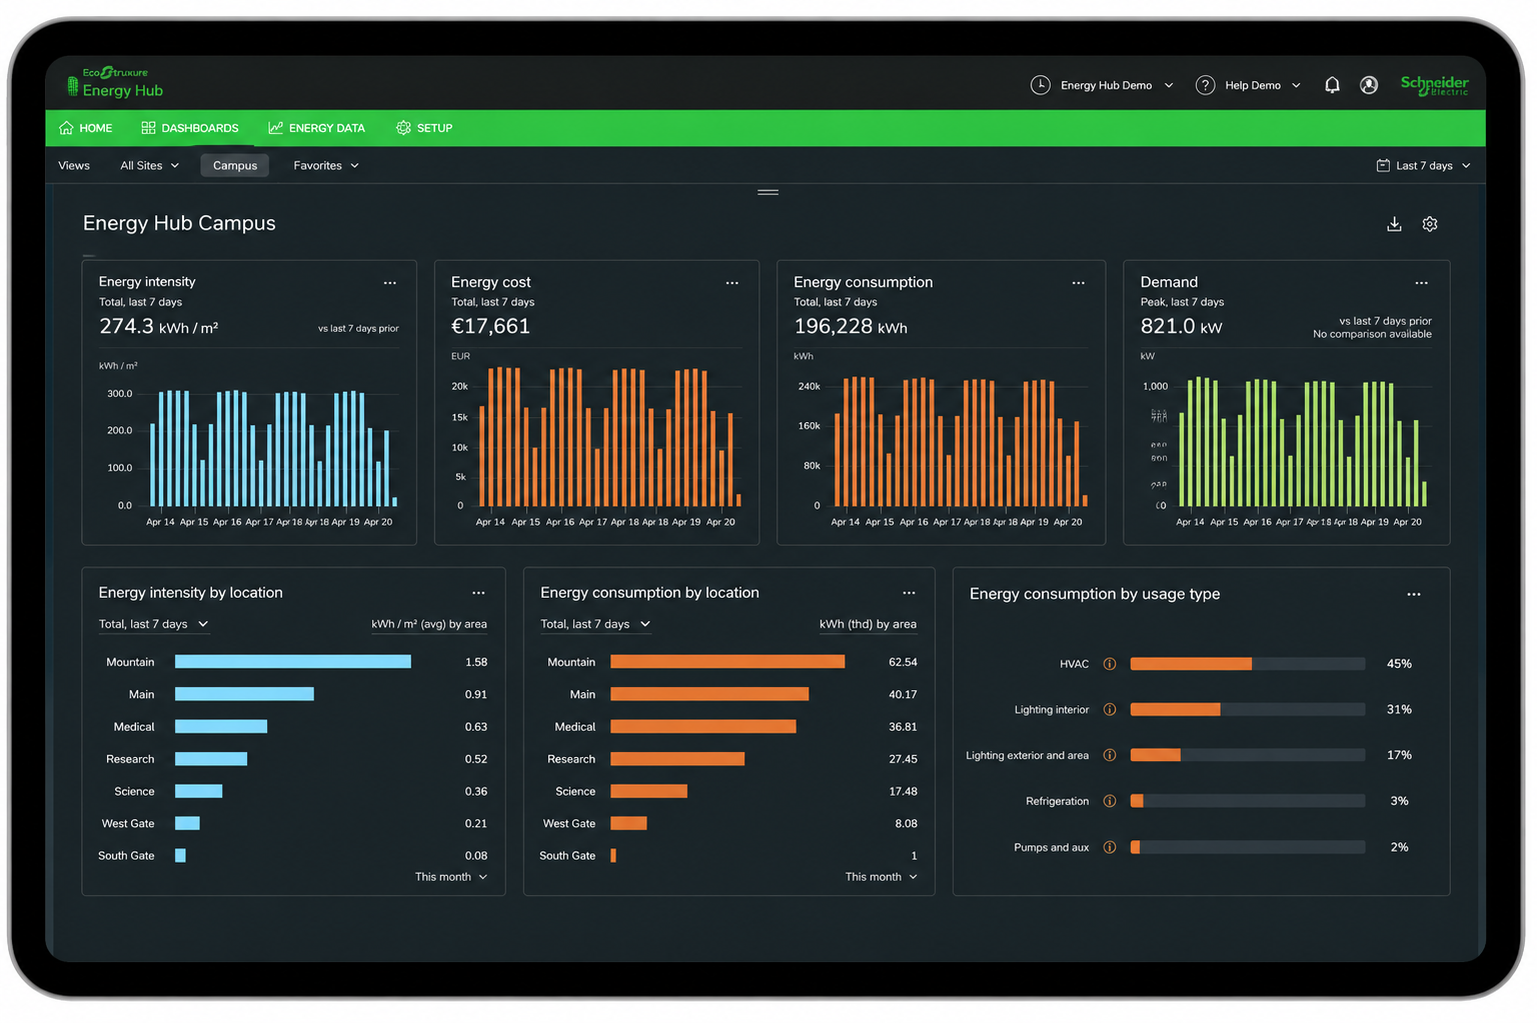
Dashboard showing Energy Hub Campus stats: energy intensity, cost, consumption, demand, and usage by location and type.
Analytics & Benchmarking
Compare buildings and sites to identify inefficiencies and improvement opportunities.
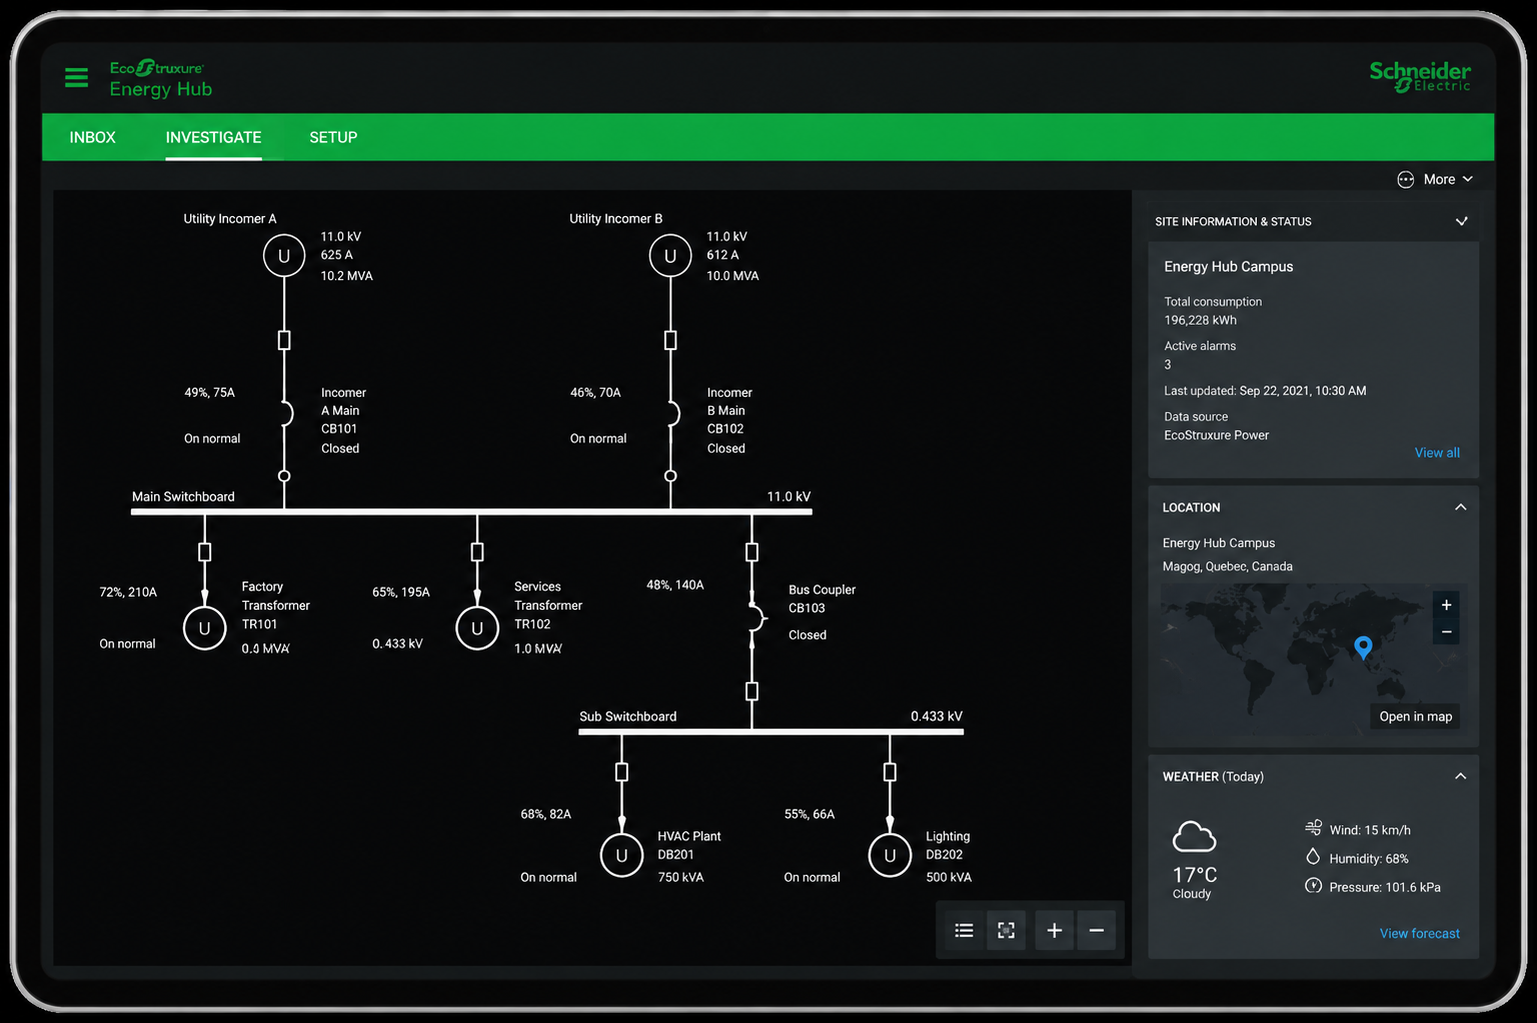
Energy Hub interface showing electrical switchboard status, transformers, location in Quebec, and weather details.
Alarms & Notifications
Receive alerts when energy use deviates from expected performance.
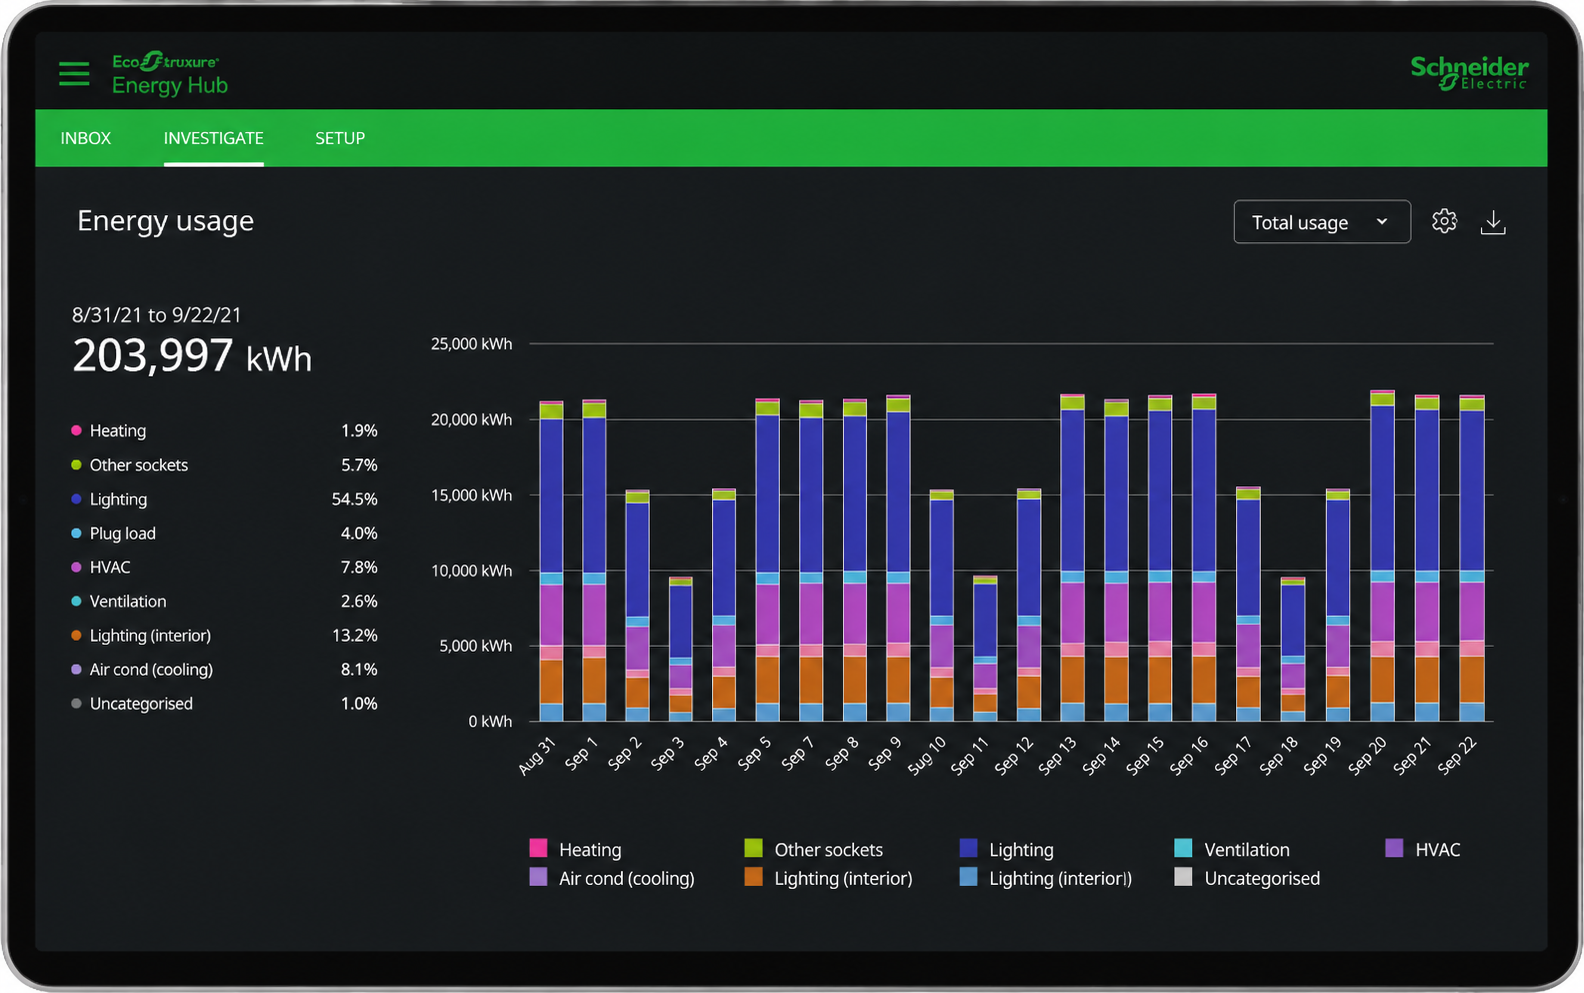
Bar chart of energy usage by type from Aug 31 to Sep 22, showing total 203,997 kWh with lighting highest at 54.5%.
Sustainability & Carbon Reporting
Support energy reduction initiatives and ESG reporting requirements.

Industries We Support

_______________
Every industry faces unique energy and power challenges. Quasar delivers tailored monitoring, analytics, and power system solutions that improve visibility, reliability, and operational performance across critical infrastructure and commercial operations.
  • 🔵 Utilities & Energy Providers
  • 🔵 Industrial & Manufacturing
  • 🔵 Commercial Buildings & Infrastructure
  • 🔵 Education & Healthcare
  • 🔵 Data Centres
  • 🔵 Government & Critical Infrastructure
Explore Our Solutions

Utility & Energy Providers

Revenue-grade monitoring for grid visibility, compliance and network resilience.
Learn More

Industrial & Manufacturing

Energy and power quality analytics to
reduce downtime.
Learn More

Buildings & Infrastructure

Scalable monitoring that improves performance and lowers energy costs.
Learn More

Education & Healthcare

Reliable energy visibility that protects critical operations and ensures compliance.
Learn More

Govt & Critical Infrastructure

Secure, compliant energy monitoring
for critical assets and infrastructure.
Learn More

Data Centres

Power monitoring that protects uptime and supports resilient, efficient operations.
Learn More

Related Software Solutions

Why choose Energy Hub

✓ Cloud platform deployment and configuration
✔ Metering integration and communications
✔ Dashboards, reports, and alarming
✔ Ongoing support and lifecycle services

Not sure which platform fits your site?

Talk to Us today